Most server owners watch TPS, ticks per second. When it reads 20, the server is fine; when it drops, players complain. The problem is that TPS only tells you something after it is already too late. A server sitting at 20 TPS can be one farm away from collapse, and TPS will not warn you.
The number that does warn you is MSPT: milliseconds per tick. This guide explains how the two relate, how to read MSPT with the command built into the game, and how to find the specific thing that is eating your tick time.
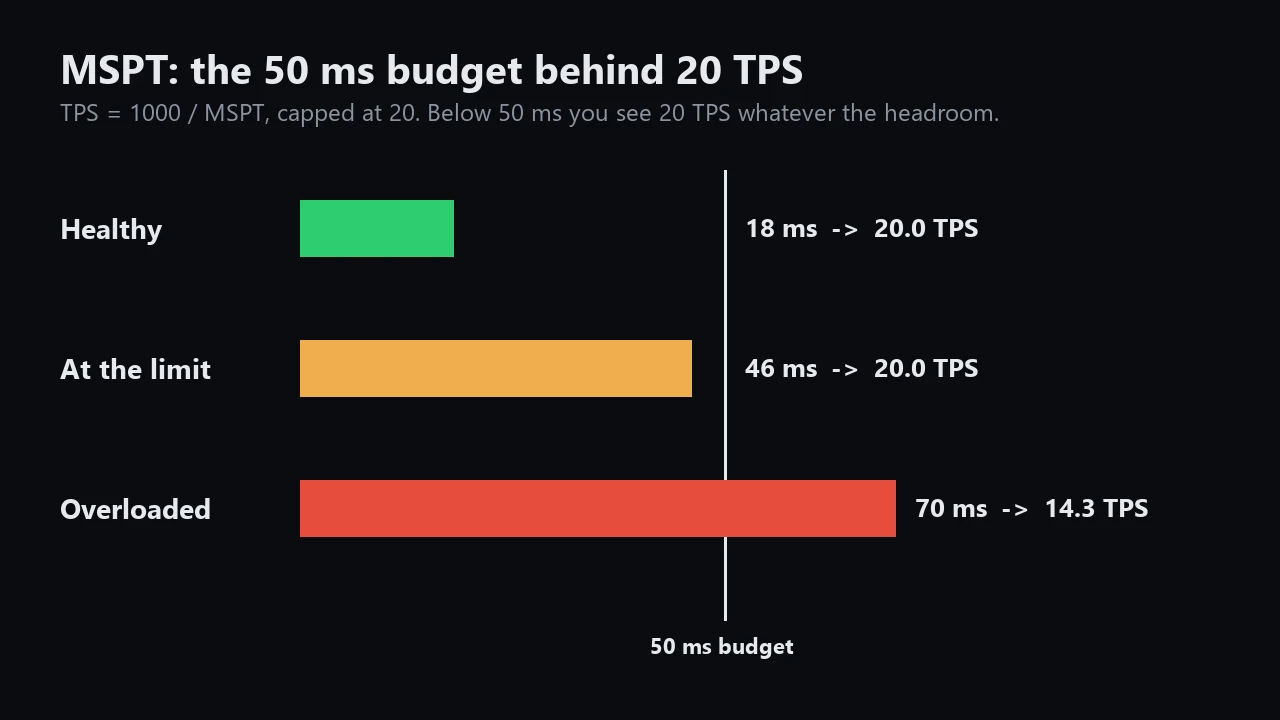 Diagram: SyntaxMine.
RateBudget: 50 ms per tick
XP level/tick query, spark
Build time10 minutes to diagnose
DifficultyAdvanced
The 50 millisecond budget
A Minecraft server tries to run 20 ticks every second. One second is 1000 milliseconds, so each tick has a budget of 50 milliseconds to do everything: move every mob, run every hopper and piston, grow crops, process players.
MSPT is how long a tick actually takes. The relationship to TPS is simple:
- If MSPT is under 50, the server finishes early and waits. TPS stays at 20.
- If MSPT is over 50, the server cannot keep up. TPS becomes 1000 / MSPT, so 70 MSPT means about 14.3 TPS, and the whole game runs at roughly 70% speed.
That first line is the trap. A server at 18 MSPT and one at 46 MSPT both show 20 TPS. One has 32 ms to spare; the other has 4. Add one more farm to the second server and it starts lagging, and TPS gave you no warning. Watch MSPT, not TPS.
Average vs spikes
An average hides spikes. A server averaging 30 MSPT can still have individual ticks of 200 ms, which players feel as rubber-banding even though the average looks healthy. That is why the tools below report percentiles as well as averages: the 95th or 99th percentile tells you how bad the worst ticks are.
Step 1: the built-in way, /tick query
Since Java 1.20.3, the game has a /tick command, and its /tick query subcommand is a free, built-in MSPT readout. It reports:
- the current ticking status and target tick rate,
- the average time per tick,
- percentiles of time per tick.
If the server cannot keep up, it says so directly: "The game is running, but can't keep up with the target tick rate."
It needs permission level 3 (an operator) and cannot be run from a command block. Run it a few times during normal play and once during your busiest moment, like when the big farms are running and most players are online.
Rough reading:
- Under about 30 ms: comfortable headroom.
- 30 to 45 ms: fine today, but plan before adding big builds.
- Consistently over 50 ms: the server is lagging, and you need to find out why.
These bands are a rule of thumb, not an official scale. What matters is the trend: if a new farm adds 10 ms, you will see it here.
Other /tick subcommands worth knowing
/tick is also a testing tool for technical players:
/tick freeze stops all gameplay ticking except players (and what they ride). /tick step <time> then advances frozen time in exact steps, ideal for watching a redstone contraption tick by tick./tick sprint <time> runs the game as fast as the hardware allows for the given time, ignoring the 20 TPS target. In a test world that is the fastest way to measure a farm's output per hour without waiting an hour./tick rate <rate> changes the target tick rate (default 20). Leave it alone on a live server.
Step 2: finding the cause with spark
/tick query tells you how much time a tick takes. It does not tell you what is taking it. For that, use spark, the profiler the technical community standardized on. It runs on Fabric, NeoForge and Paper, and covers both servers and clients. (Our complete performance guide covers installing it.)
The commands that matter:
/spark tps prints the server's TPS and CPU usage./spark health generates a health report: TPS, CPU, memory and disk./spark profiler start starts recording. Add --timeout 120 to stop automatically after two minutes, and --only-ticks-over 50 to record only the ticks that went over budget. That flag is the key to diagnosing spikes: it ignores the fine ticks and shows you only the bad ones./spark profiler stop stops recording and gives you a link to the results. /spark profiler open opens the viewer without stopping./spark tickmonitor reports individual ticks that exceed a threshold, either a duration in milliseconds or a percentage over the average.
Reading the profile
The spark viewer shows a tree of where tick time went. Do not try to read all of it. Follow the widest branch down:
- Open the server thread and expand the tick section.
- At each level, expand the child that takes the largest share of time.
- Stop when you reach something you recognize: entity ticking, block entities (hoppers, furnaces), chunk loading or generation, or a named plugin or mod.
The answer is usually one of a handful of things.
The usual suspects
| What spark shows |
Usual real cause |
What to do |
| Entity ticking dominates |
Too many mobs or items: farm overflow, cramming, item piles |
Add kill limits, clear ground items, cap animal pens |
| Villagers high in the list |
Large trading halls and breeders pathfinding |
Lock villagers in 1 x 1 cells, reduce counts |
| Block entities: hoppers |
Long hopper chains and unlocked hopper lines |
Shorten chains, lock idle hoppers with redstone |
| Chunk generation / loading |
Players exploring new terrain |
Pre-generate the world |
| One plugin or mod |
That plugin or mod |
Update, configure, or replace it |
| Garbage collection pauses |
Memory pressure, wrong JVM settings |
Check JVM flags and how much RAM |
Two of these deserve a note. Simulation distance controls how many chunks around each player are actively ticked, so lowering it cuts entity and redstone load directly (render vs simulation distance). And more RAM is rarely the fix: if the profile shows entities or hoppers, extra memory changes nothing.
A 10-minute diagnosis routine
- Run
/tick query at a busy moment. Note the average and the percentiles.
- If the average is high, run
/spark profiler start --timeout 120. If only spikes are the problem, add --only-ticks-over 50.
- Open the link, follow the widest branch to the cause.
- Fix that one thing.
- Run
/tick query again and compare.
One change at a time, measured before and after. That is the whole method.
Frequently asked questions
What is MSPT in Minecraft?
Milliseconds per tick: how long the server takes to process one game tick. The budget is 50 ms; under it, the server runs at a full 20 TPS.
What is the difference between MSPT and TPS?
TPS is ticks per second, capped at 20. MSPT is how long each tick takes. Below 50 MSPT, TPS always reads 20, so MSPT shows how much headroom you have and TPS does not.
How do I check MSPT without mods?
Use /tick query (Java 1.20.3 and later, operator permission level 3). It shows the average time per tick and percentiles.
What is a good MSPT?
As a rule of thumb, under about 30 ms is comfortable and over 50 ms means the server is lagging. Watch the trend after adding builds.
What causes high MSPT?
Most often too many entities (mobs, items, villagers), long hopper chains, chunk generation from exploration, or a single heavy plugin or mod. A spark profile shows which.
Does adding RAM fix high MSPT?
Rarely. If the profile shows entities, hoppers or generation, more memory does not help. Fix the cause the profiler points to.